


"Here to Help" is a support column written especially for Formstack's awesome, loyal customers.
Formstack is a great tool for collecting all the information you need from prospects, customers, employees, and more. But it’s not just for collecting data. Our form builder has some powerful form analytics features that can help you view and analyze your data for deep insights.Using functionality found in the Submissions tab of the Formstack database, you can create specialized reports of your submitted data. These reports can be designed around a number of parameters, meaning the data can be sliced and diced in whatever way is most helpful to you.Want to know more? Here are a few steps you can take to create and use custom reports in the Formstack database:
1. Use Filters to Pull Specific Data
To create a custom Formstack report, you’ll want to start by setting up one or more filters from the Submissions tab in the database. To do this, simply select New at the top of the screen and then Filter. When the Filter Submissions options pop up, create up to five filters to search your data and display only submissions that meet your filter criteria. When your filters are ready, select Save & Search to run the report.Once the report has been run, it’s a good idea to give it an identifying name by clicking the edit icon next to the Untitled text and typing the desired name. This will allow you to easily find the report at a later time in your Report dropdown menu.Want to see these steps in action? Watch below as we filter results from a customer survey to show only those submissions where users indicated they work in an IT or operations department.
Note: You can edit your report at any time in the following ways:
- Click Columns to choose which columns (or field submissions) you want to display in your report.
- Click Filter to edit the filters you’ve set.
- Click the edit icon next to the report name to change the name.
- Click the delete icon next to the report name to delete the report.
2. View Visual Charts of the Reports
Once you’ve run a custom report in the Formstack database, you can use our charts feature to visualize your data with presentation-ready charts and graphs. Please note that charts can only be created to display the submissions made to a qualifying field type: Dropdown List, Checkbox, Radio Button, Matrix, and Number.To view charts for your report, click the Charts tab on the right side of your submissions table. You will immediately see colorful charts for any submissions in your report that were made via a qualifying field type.
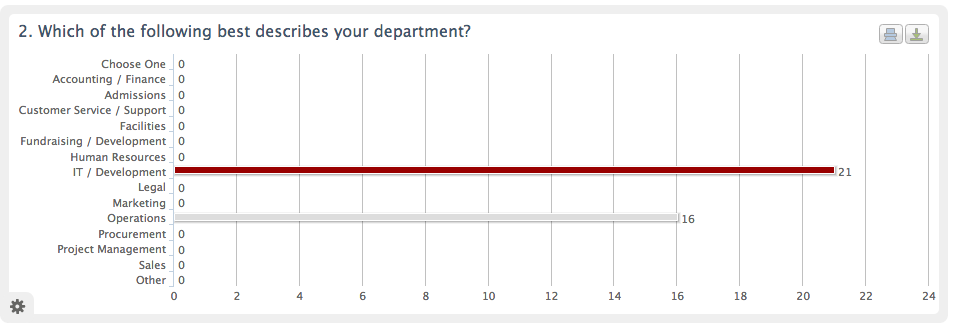
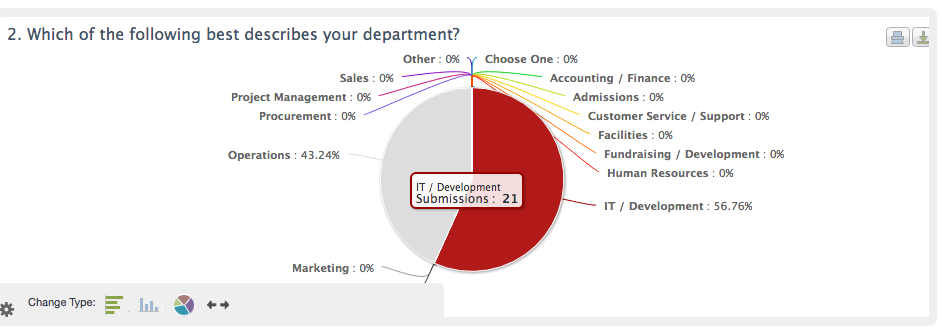
You can easily toggle between three different chart types: a horizontal bar graph, a vertical bar graph, and a pie chart. To change the view, simply click the gear icon in the bottom left and then the icon for the desired chart type.
Here are a couple notes to keep in mind when using charts:
- By default, your charts will be displayed two to a line. You cannot set charts to always display one to a line. You must manually expand each chart by clicking the gear icon in the bottom left and then the outward-facing arrows.
- For security purposes, chart functions are not available on encrypted forms.
3. Share and Analyze the Data
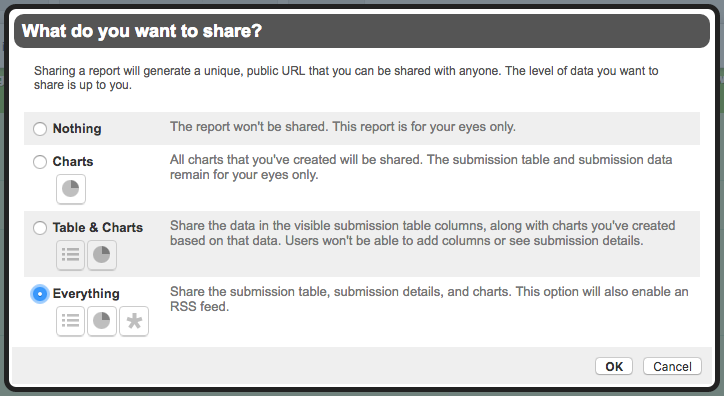
Formstack’s custom reports can be a great way for you to analyze data from customer or employee surveys, lead generation forms, and more. And sharing your findings with your team is easy!To create a share link for a report, simply click Share above your submissions table and choose how you want to share the report with your team. This feature allows you to share only the charts, the data table and charts, or everything.
Once you choose your share level and click OK, a share link will be generated. You can right click on the link to copy the link address, or you can left click on the link to be taken to the shared data/charts. You can then copy the URL displayed in the browser bar at the top of the page and share that URL with others.
Want to dive further into submission data? Learn more about Formstack’s form analytics features.

